Re: View of Parks is a mapping installation and research project that is part of the What if Parks Were Safe for Everyone? Installation. The purpose is to allow people to share their views and experiences of parks in Tkaronto, and to invite reflection on their experiences and how they may be similar or different to others. Along with providing a space for participants to dream of future parks together, and provide feedback on ways to improve parks.
Work created for the Department of Imaginary Affairs.
Background
This project came about as a reaction to the way current park designers do research in parks to gain community’s inputs on new parks, which were generally through town halls. DIA felt like this was an inaccessible way to get community input, where town halls are at set times which may not work for every community, especially ones with people who may be working shifts outside of a 9 to 5. Community members may also not feel comfortable going to a town hall or are unsure what this entails at all. So, we wanted to develop a better way to get insights into this complex situation of building parks that include community insights.
Problem: How can we explore people's thoughts and experiences of parks beyond the typical approach? Gain insight on feelings of safety, likes and dislikes about parks, and ways parks should be improved.
Iterations
When brainstorming for this installation, I had to research and design the questions that would be asked, what medium this would be on, and how it would look as an interactive installation.
Questions and topics that I potentially wanted to propose and explore were:
- Share with us a moment you felt unsafe/safe in a park
- What feelings occurred? Did you experience flight, fights, faun, or freeze?
- What time of day did the experience occur? Were you with anyone? What park was it?
- What would you like to change or keep in parks to continue your feeling of safety?
Medium Exploration
As this installation was in person and had a lower budget, turning to more simplistic paper and tactile objects was key.
From the beginning, I felt that a map would be an important way to express the locations of people's experiences, where someone could pin a park or space that was influential to them. I debated between having the map be a broader map of Toronto or more of a specific neighbourhood that the installation was in. In the end, I chose a map of Toronto as it was pointed out that people can be visiting from beyond the neighborhood and it would lead to a larger variety of responses.
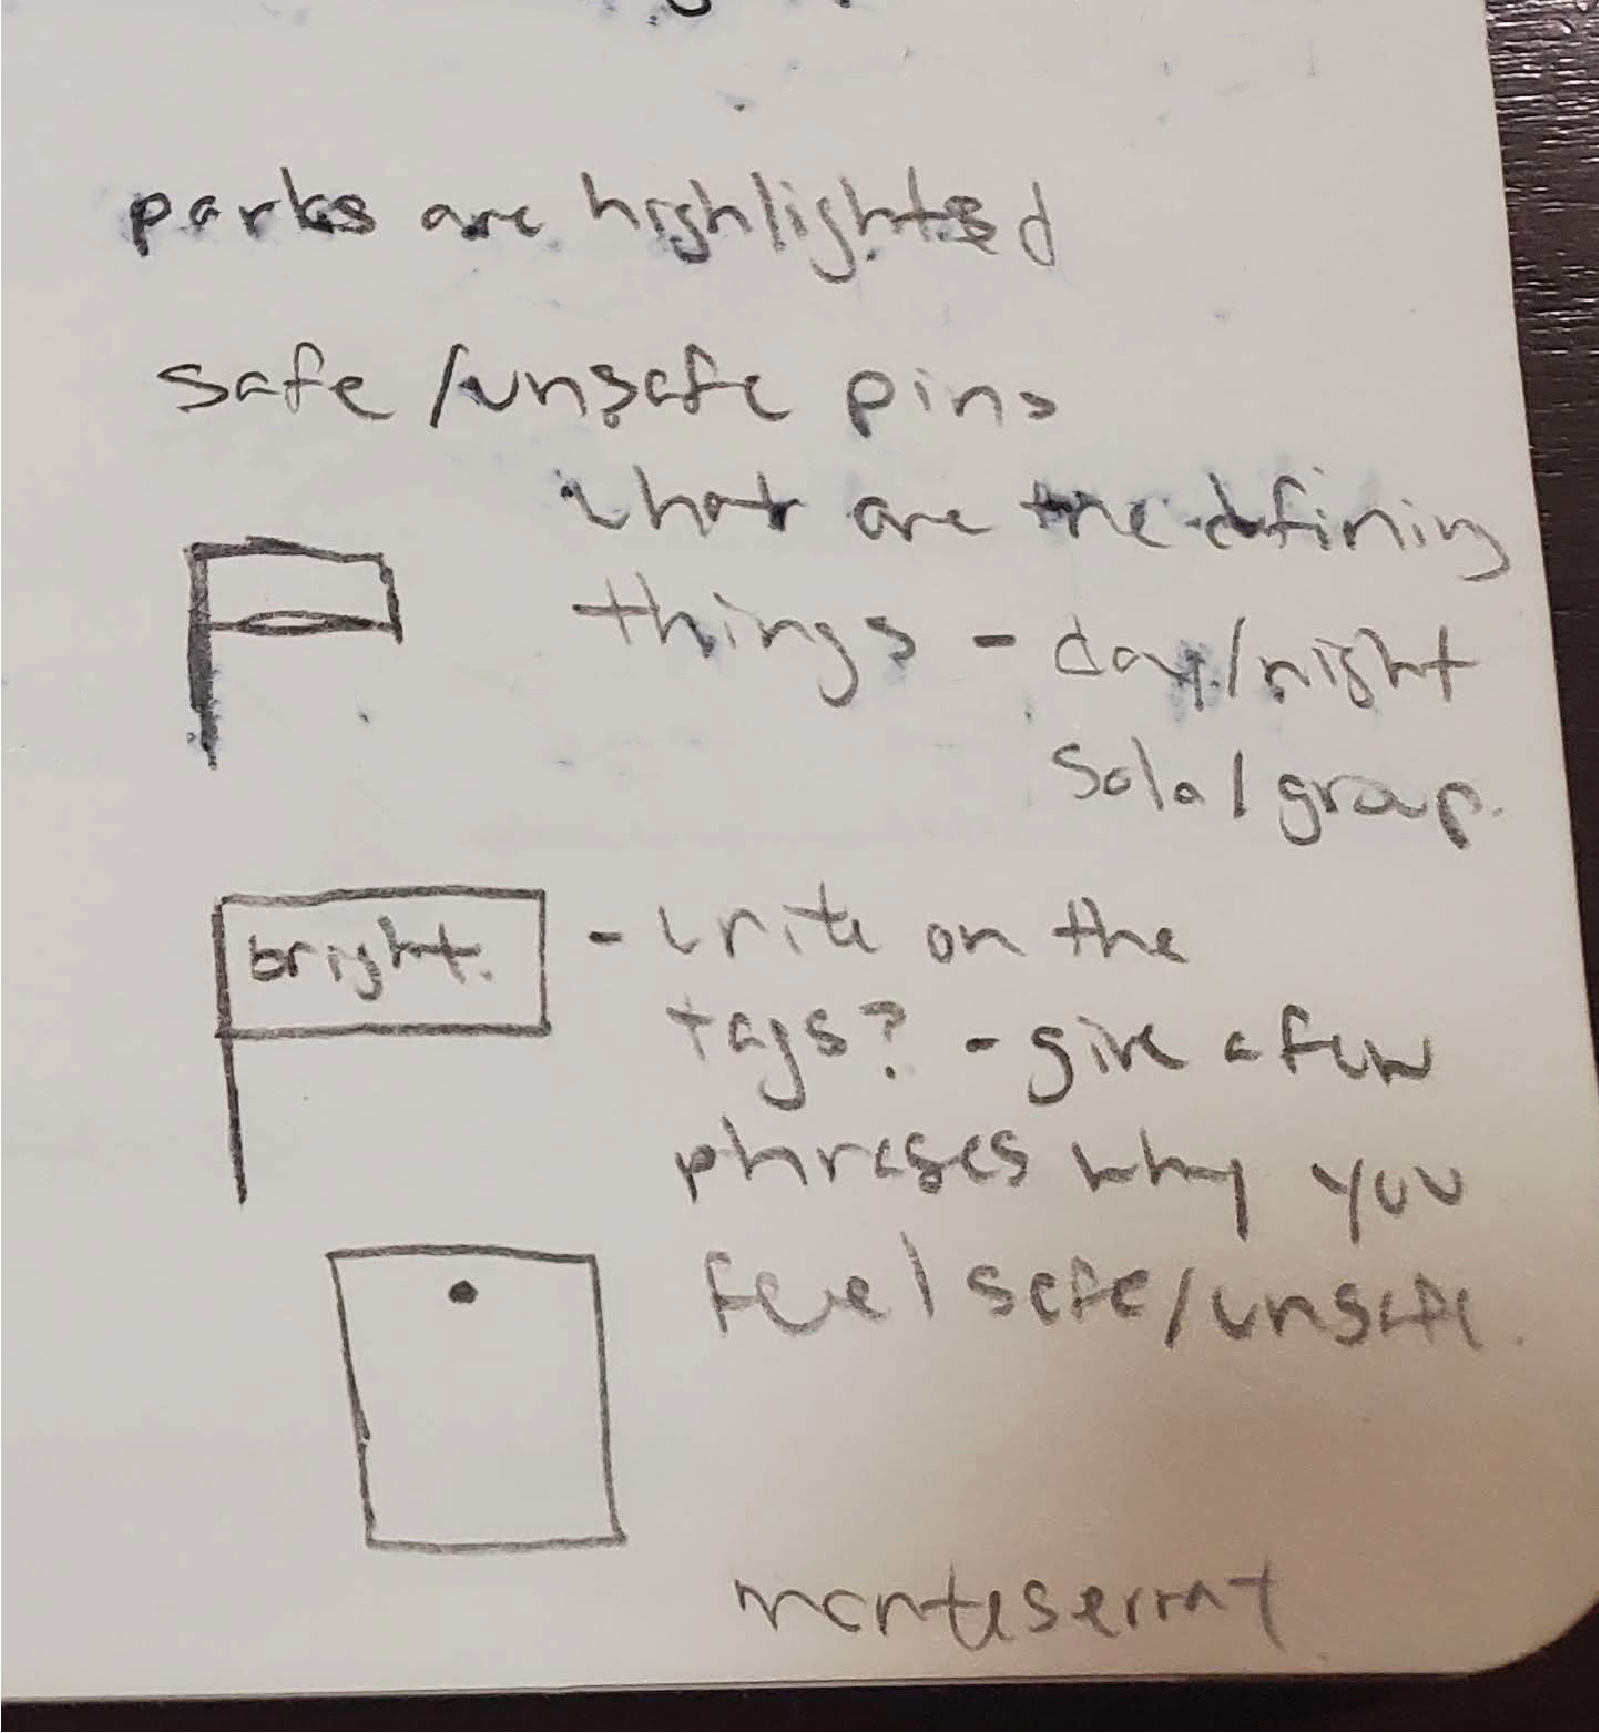
Deciding what to pin to the map was harder. I explored the idea of small coloured flags, where a colour would correspond to a different feeling, this felt complicated from a logistics standpoint and understanding too if a legend was needed. Maybe people could write how they feel on a piece of paper and pin it up, this seemed like it could lead to a broad range of responses that won't be easily viewed by others, as there isn't an organization of opinions.
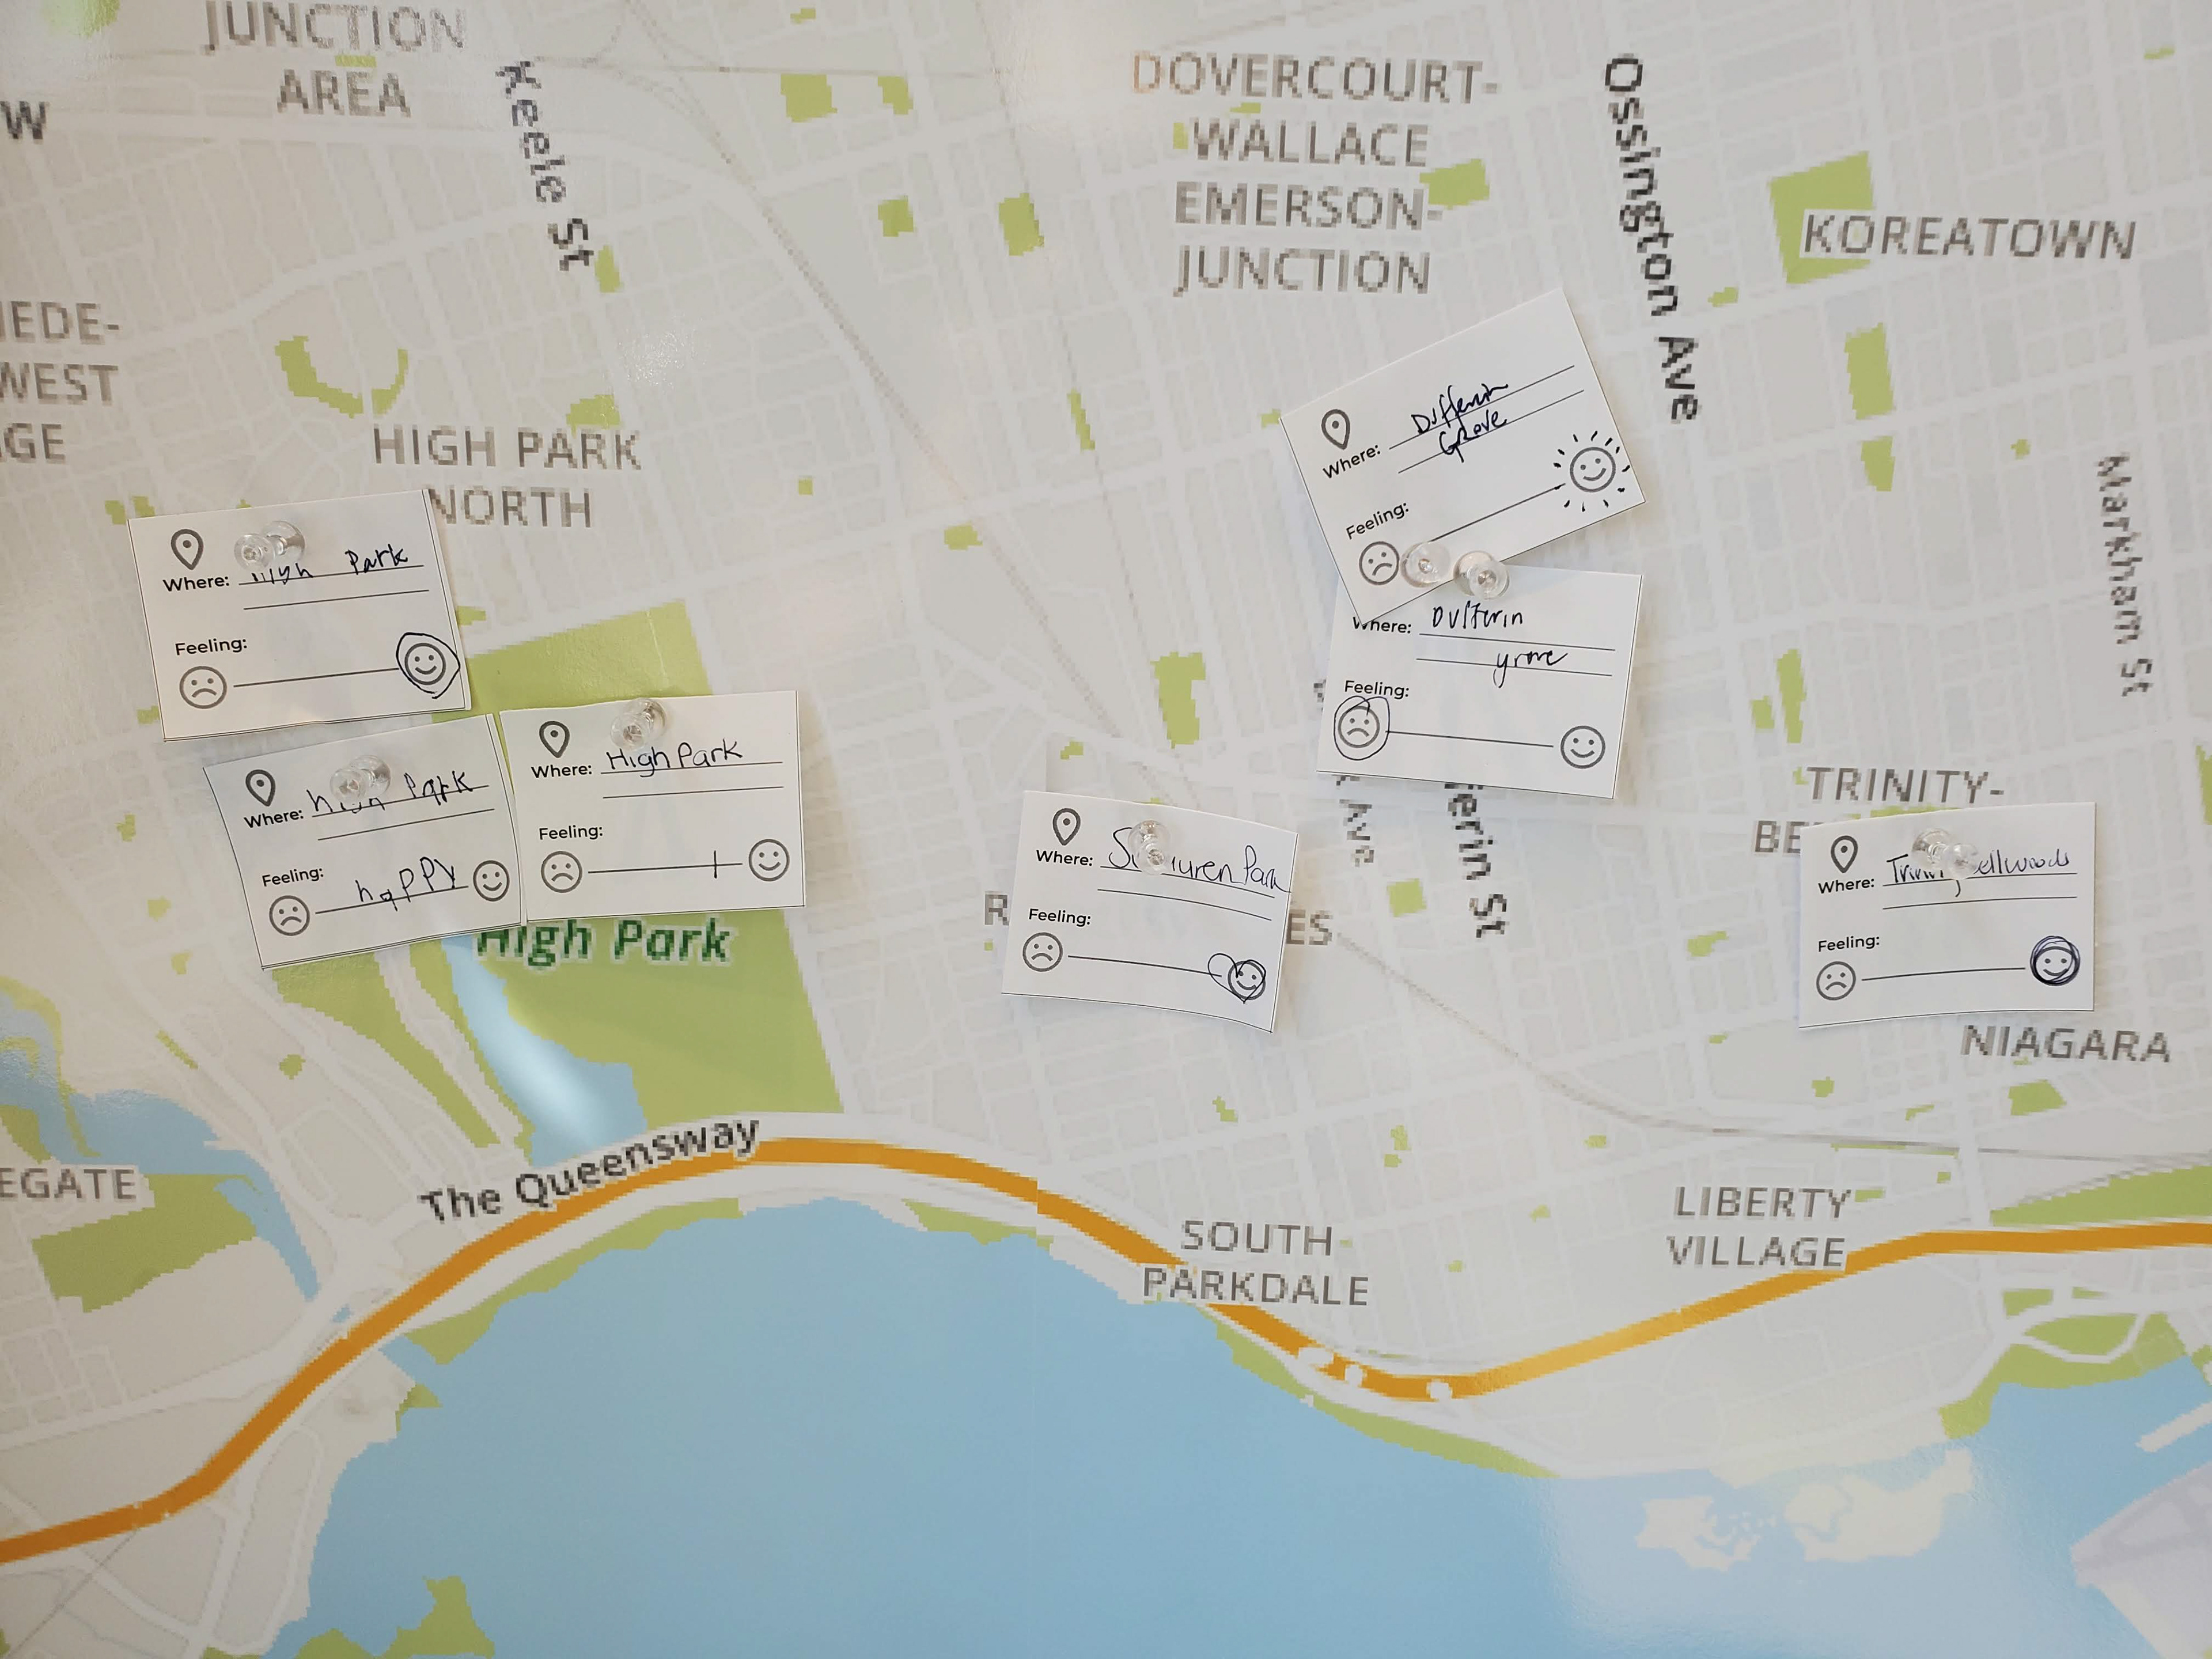
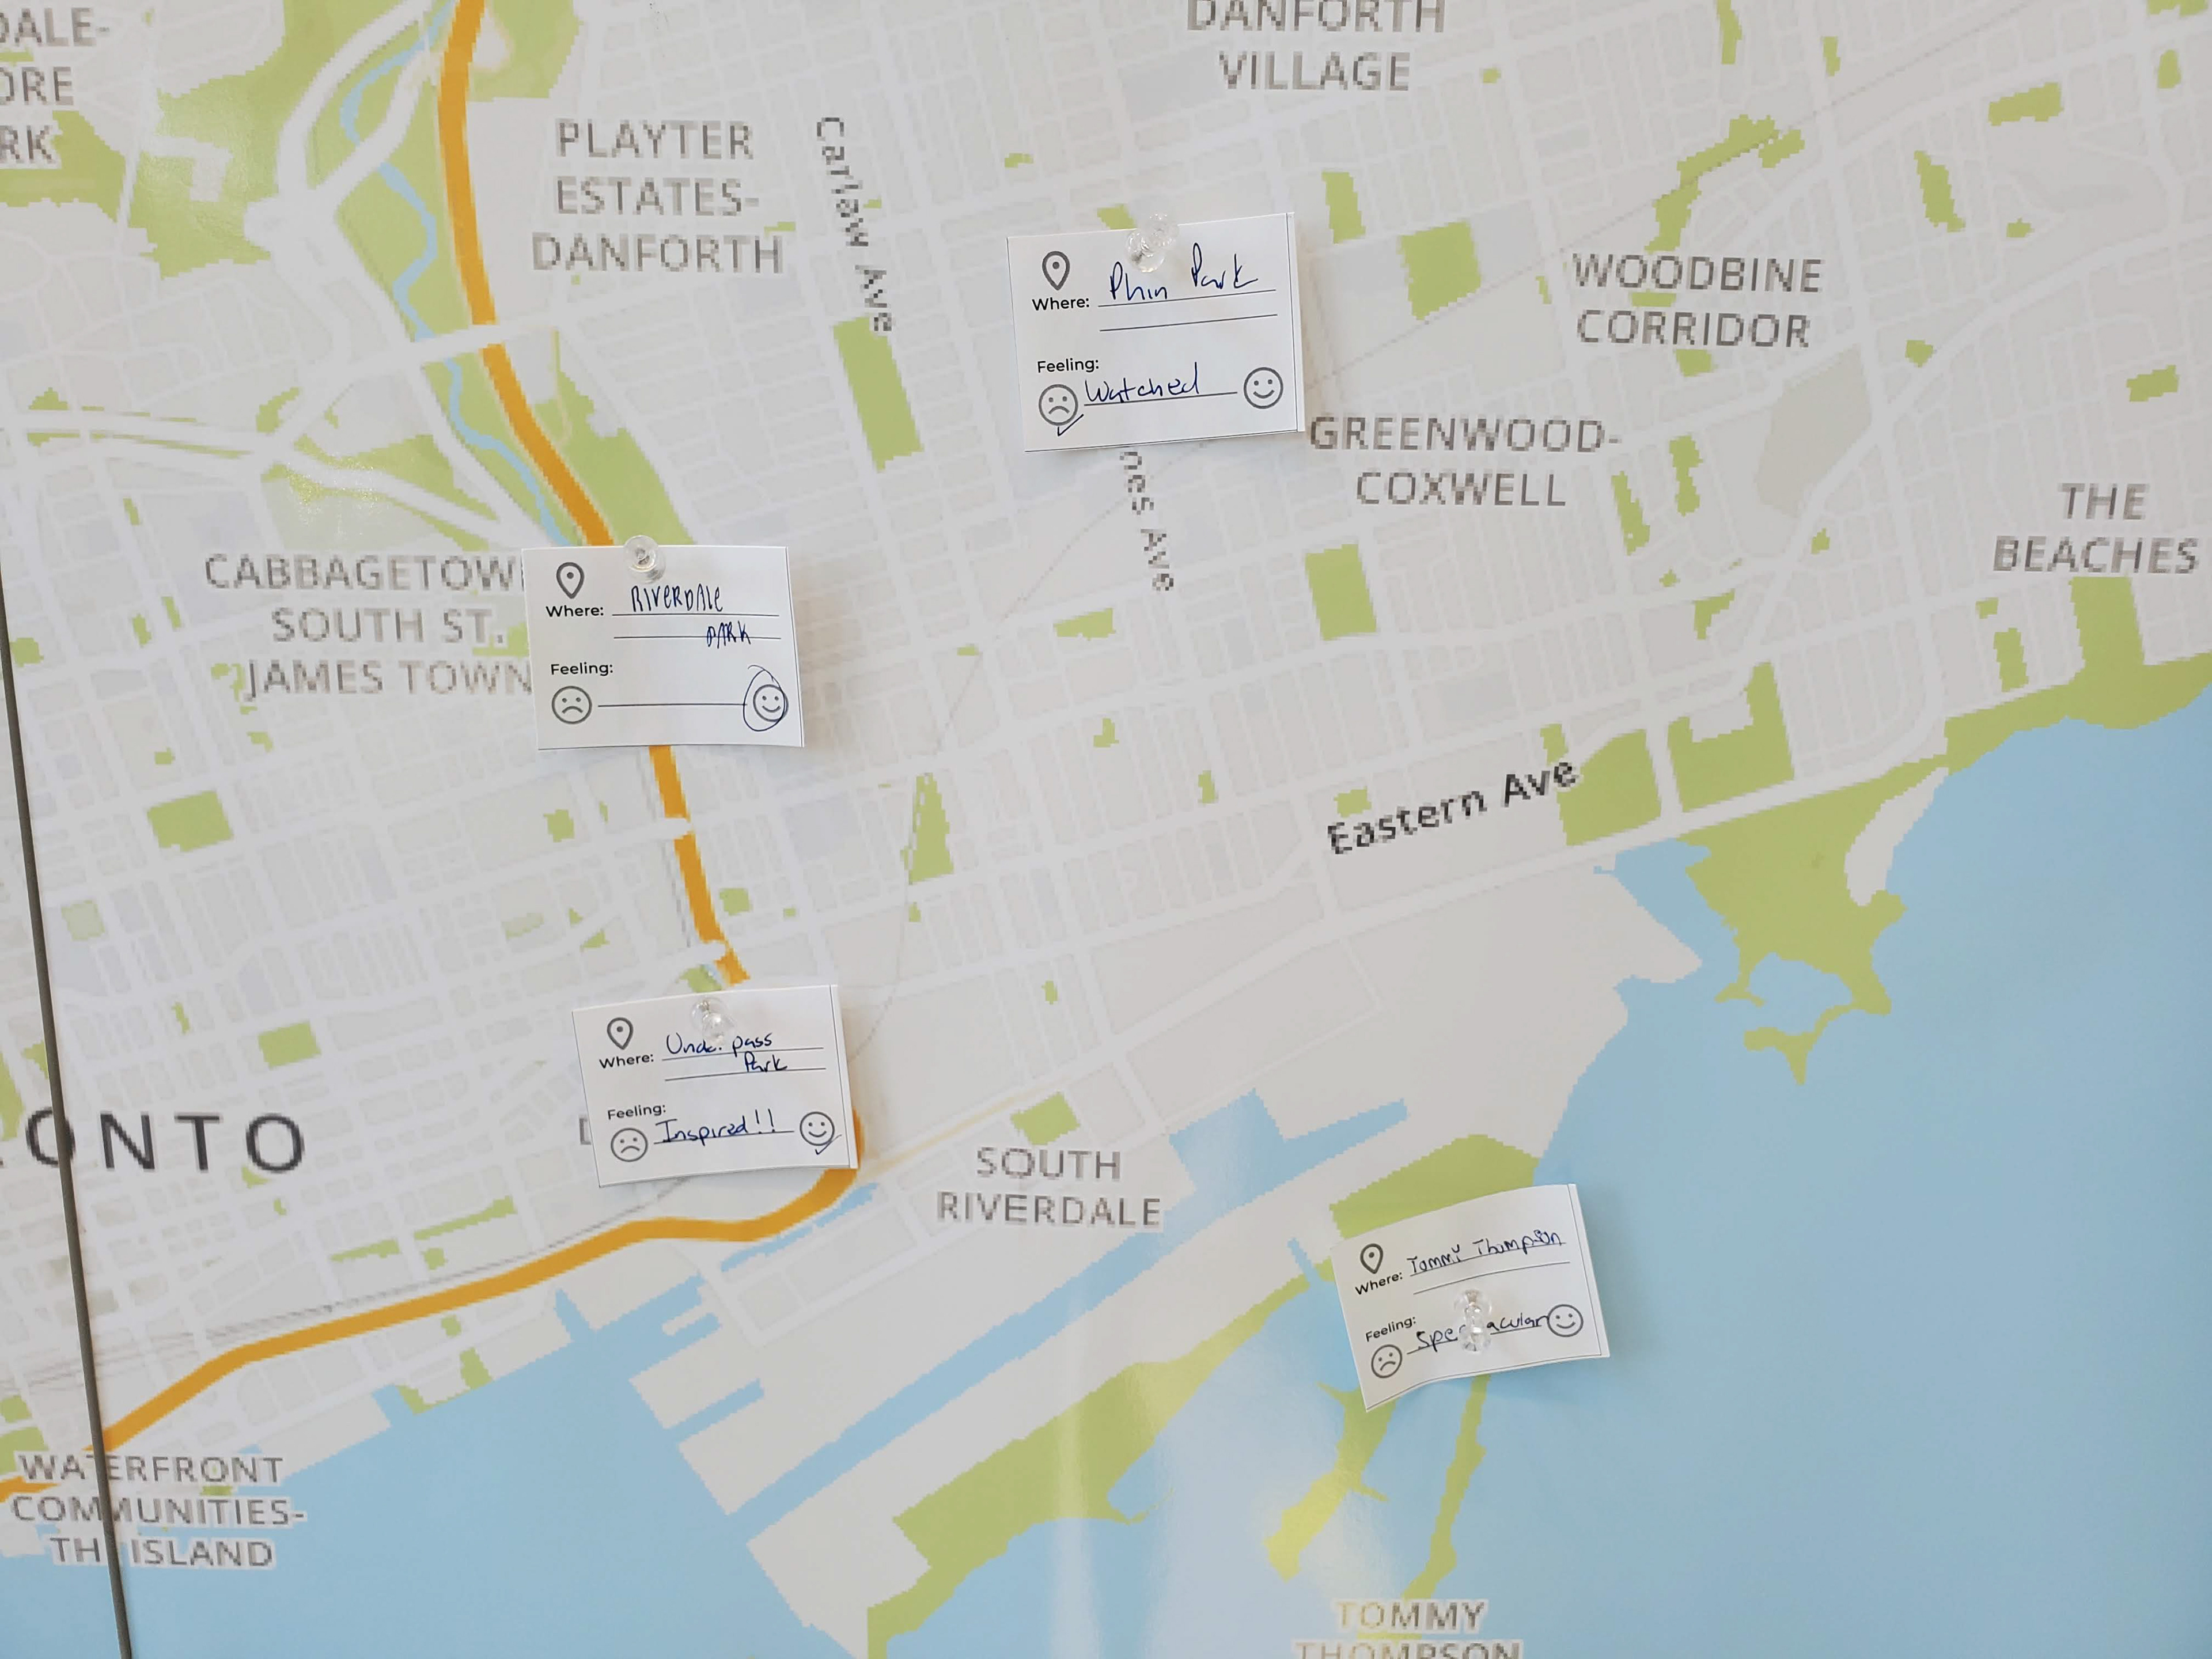
In the end, the research method I came up with involved pinning up a rate of emotion tag onto a park or space. These were slips of paper with a sad face on one end and a smiley on the other that people could tick where on the scale they were and add a phrase of how they felt and the location they felt this. This offered a spectrum for people to choose from, and visibly show to others a clear denotation of how someone felt in a certain space without the need for words.
Visualizing the Installation
As the installation is in person and the audience would range from adults to kids, I wanted the installation to be as interactive as possible.
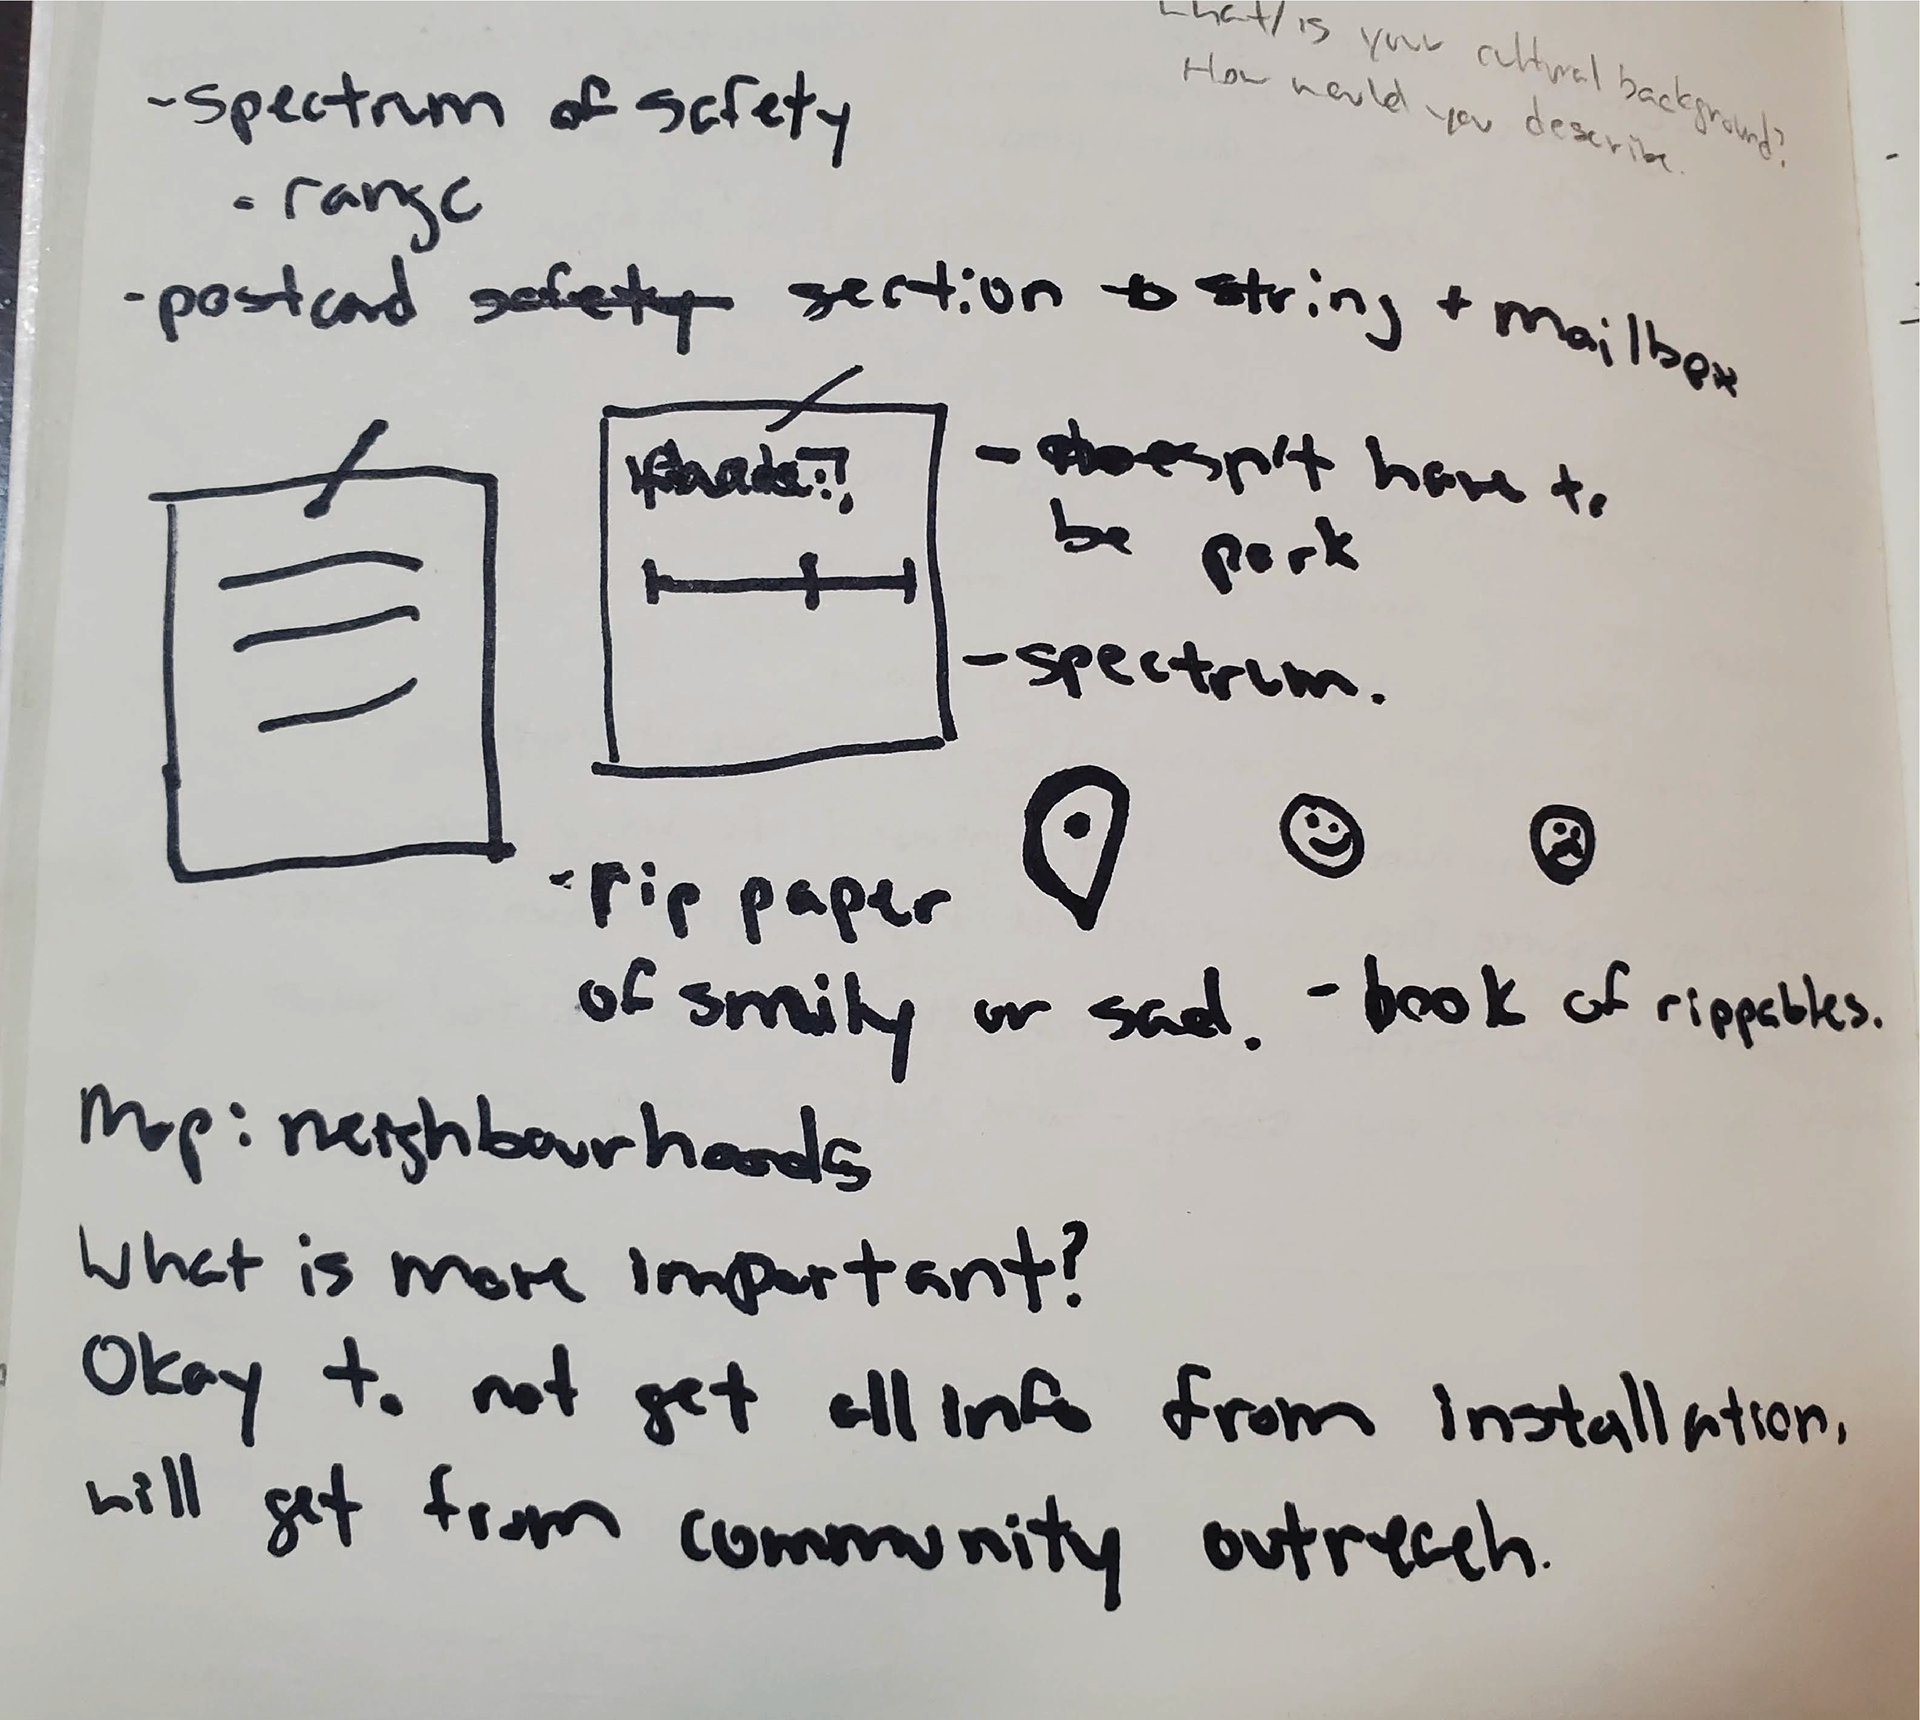
The picture on the right shows a sketch of an idea where I could split the map into four-column sections and below each would have pockets where people could place their responses to the survey so that it corresponds with that area of the map. In the end, I decided that this would be too complex and having pockets, people may not feel enticed to reach in and read them compared to if they were displayed in the open.
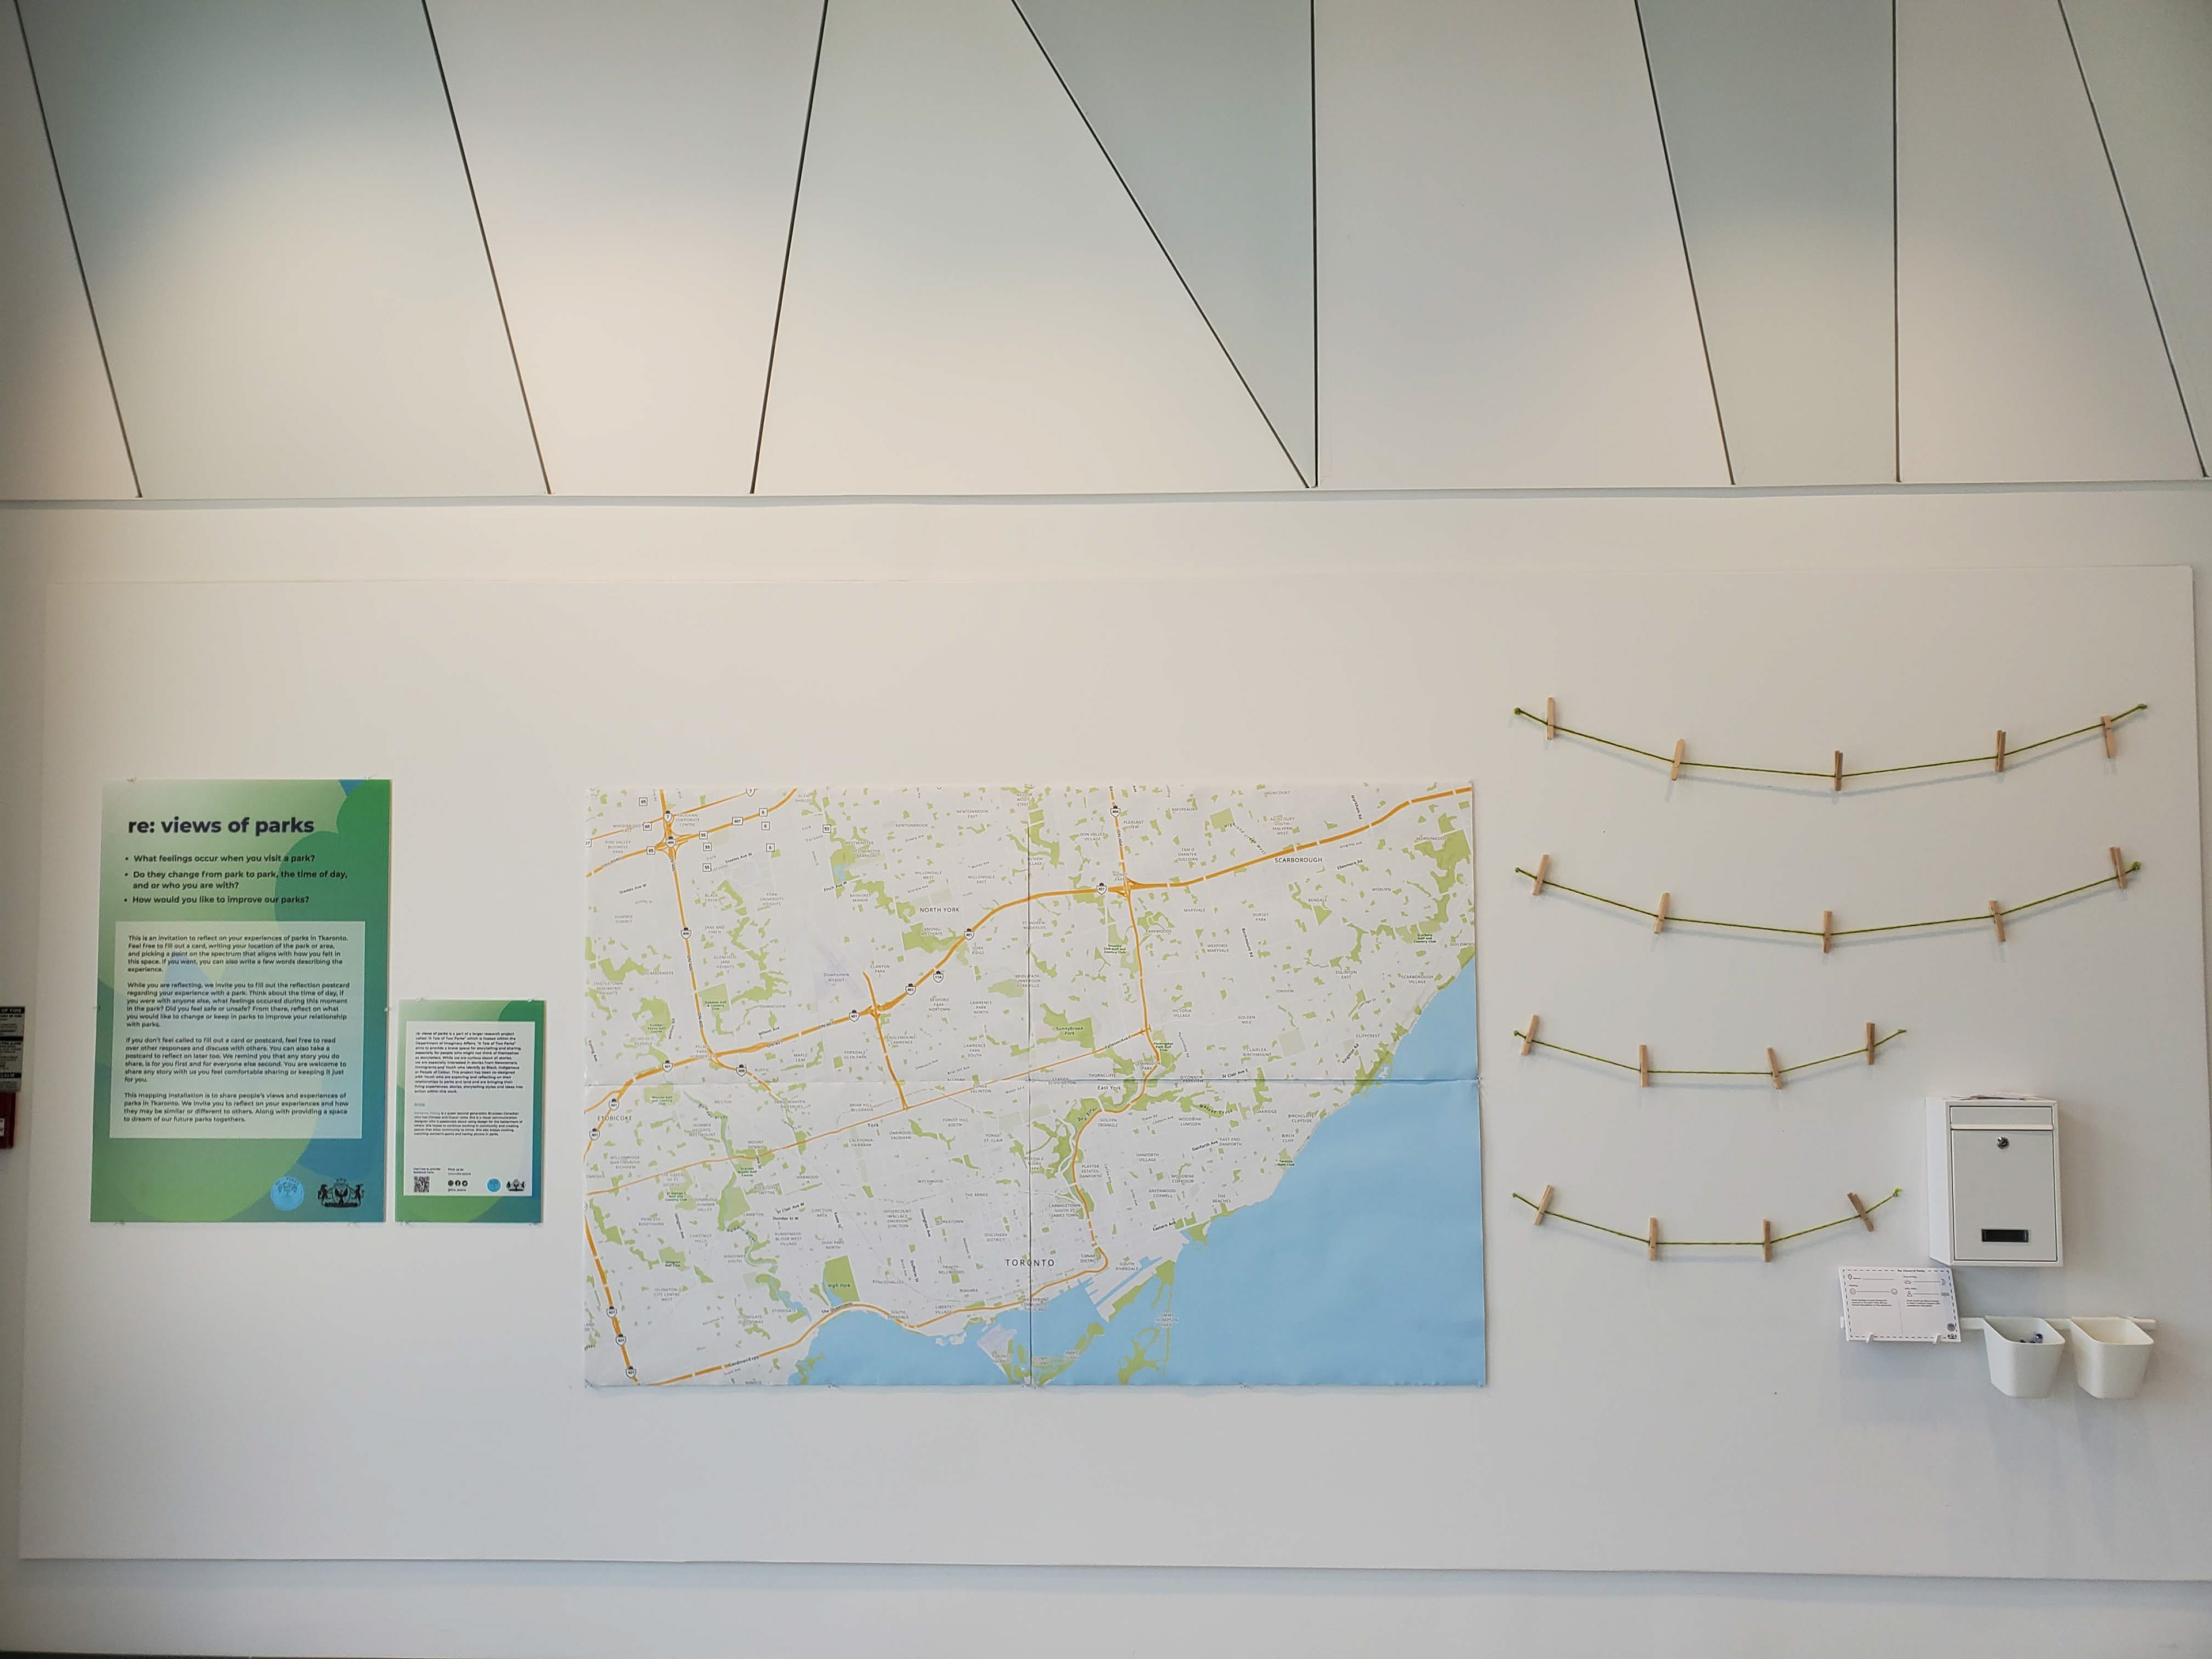
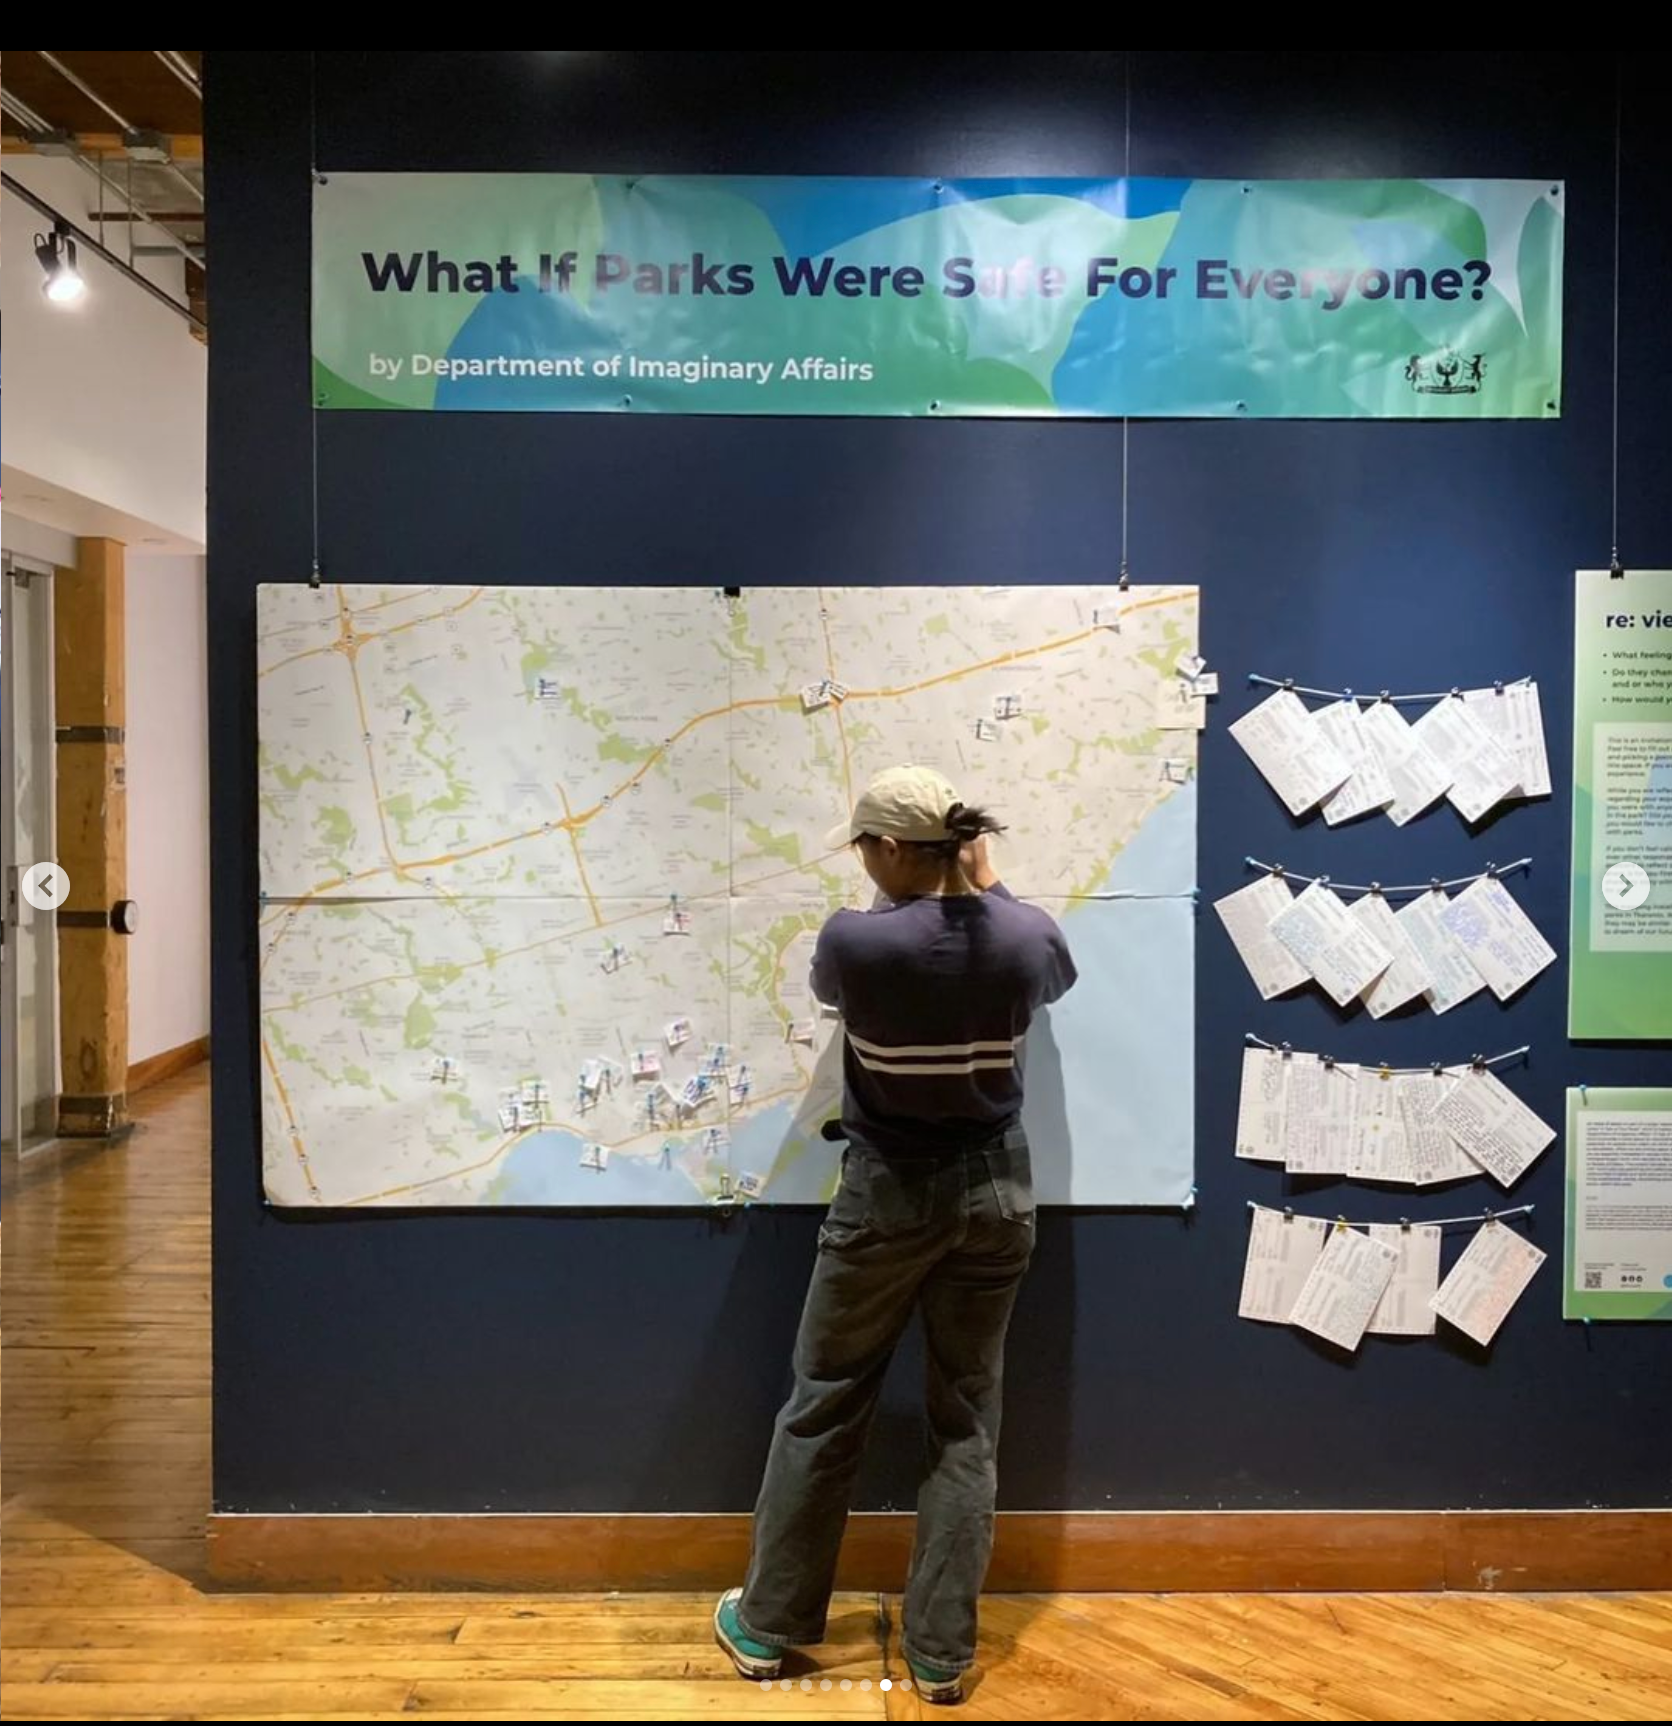
The final installation instead had a large map for reaction tags to be pinned to, and beside it strings that people could pin their survey responses to. There was also a mailbox for people to submit their survey responses if they didn't feel comfortable sharing their responses publicly.

Survey
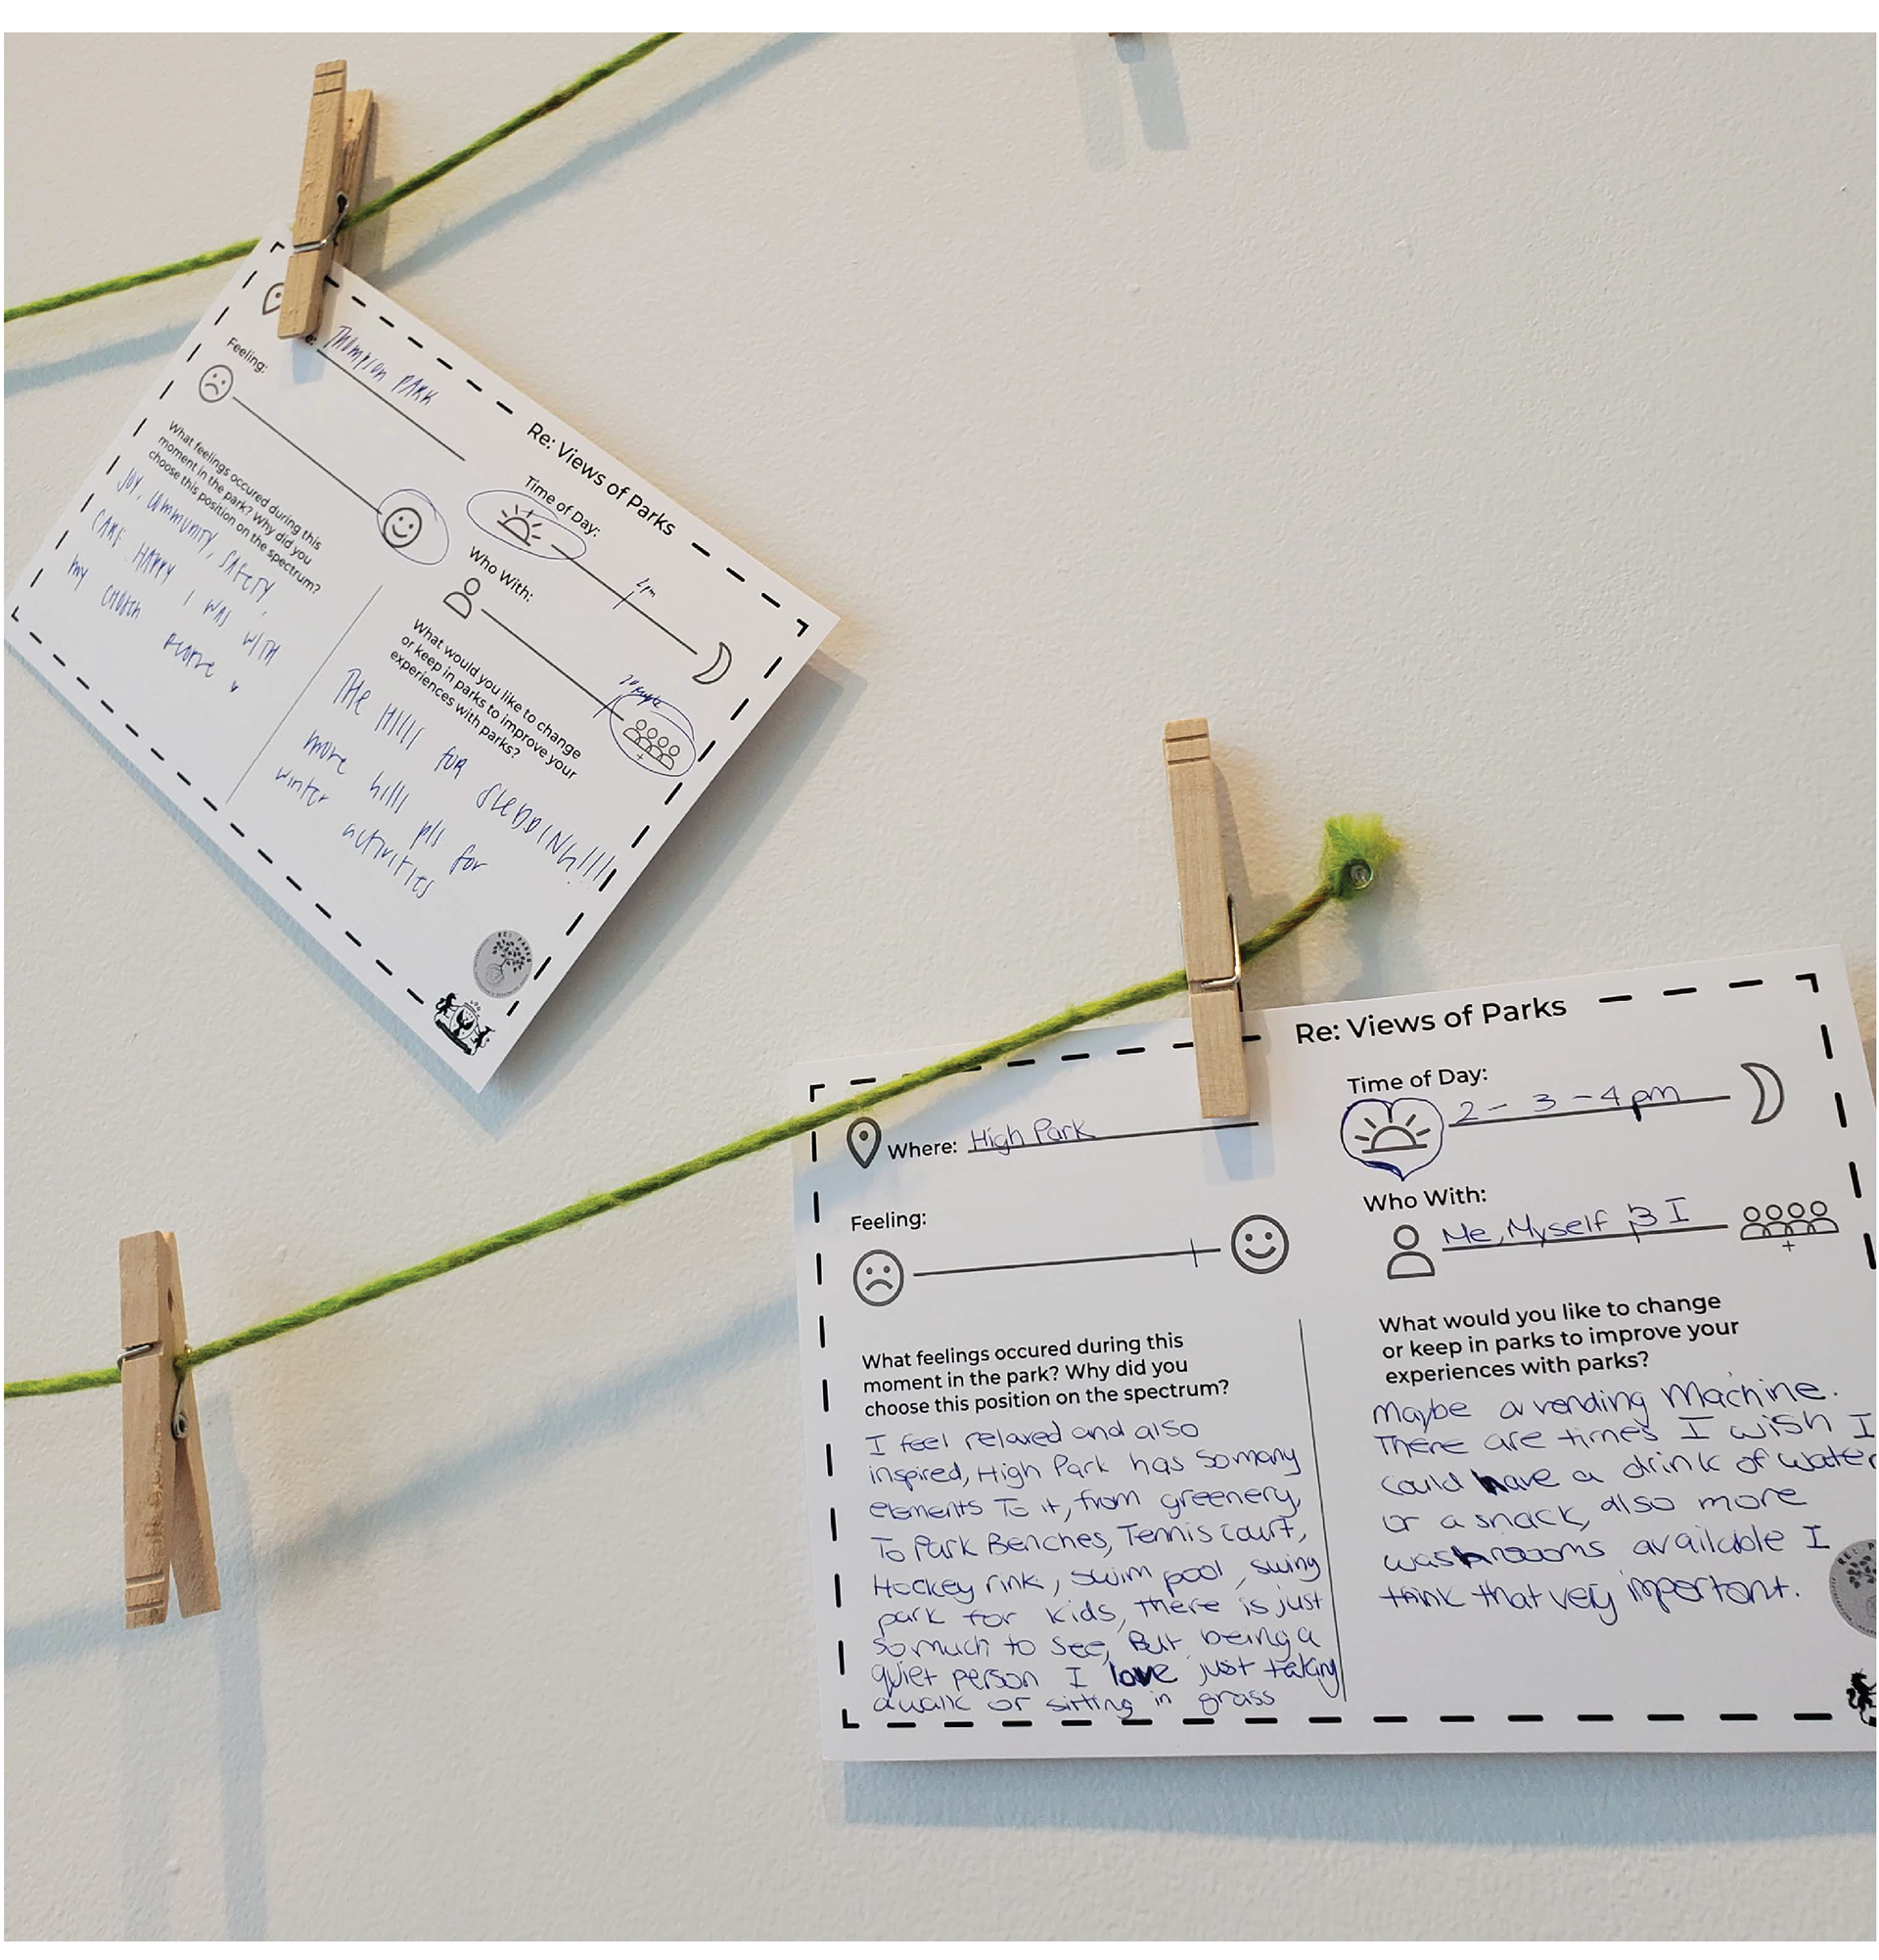
The installation also had a survey that people could fill out that goes into more specifics of where and why they felt the way they felt in a park. Along with ways they may want to improve a park. People could pin the survey up on a string for others to view or submit it in a mailbox if they didn’t feel comfortable sharing.
The survey asks for the location, time of day, feeling, and who with as a descriptor of someone's park experience. These are given in a scaled format like the map tags above, this allows people to offer a spectrum of choice and when iterating was an easier choice to fill compared to ticking off multiple boxes or writing an answer down.
The questions asked after are:
- What feelings occurred during this moment in the park? Why did you choose this position on the spectrum?
- What would you like to change or keep in parks to improve your experiences with parks?
Results & Reflection
This installation led to lots of responses, more people did the tag pinning on the map compared to the survey but there was a diverse range of answers and some themes showed up for certain parks. There was also lots of engagement and good conversations were had with community members about parks and their design.
I was only able to have the map up in one gallery during my contract, but it was part of another show and is intended to be brought to different parks within Toronto to engage community members. I do wish I was able to facilitate this research beyond my one area as exploring more data would have been interesting.
I would want to try out different iterations of the map, where I could add the transit line and more landmarks so that people can recognize the areas better. Or do a zoom-in of certain areas of the map when facilitating in that specific park or space. I would also want to incorporate a digital aspect of the survey, where people can bring the survey home to do and submit it digitally rather than needing to share it on the spot in writing.
Overall, this project showed that I can step outside the box and experiment with the methods I research. That I don’t necessarily have to take the traditional route and can re-think design methods for the better and adapt them to the communities I am working with or the context of the project. This is something I will keep in mind when working on future projects.